DIRAC × DBiT-seq Reproducibility Demo (version-pinned to 0.1.1.post1)
This tutorial reproduces our DBiT-seq integration results using DIRAC v0.1.1.post1.The current DIRAC version is 0.1.8; APIs differ slightly. We therefore pin the older version for perfect reproducibility and note key compatibility tips for 0.1.8 at the end.
Table of Contents
Environment & Version Pinning
Data & Layout
Step-by-Step Pipeline
1) Imports, seed, palette
2) Load data & basic metadata
3) Preprocess (RNA & Protein)
4) Spatial graph (BallTree, radius + k)
5) Pack data & train DIRAC
6) Neighbors, clustering, spatial plot, save
Notes & Tuning
Version Compatibility (0.1.1.post1 ↔ 0.1.8)
Overview
Goal: Integrate RNA and Protein (ADT) from a DBiT-seq sample, learn a shared embedding, and identify spatial domains.
Key choices in this reproducible run:
Old API (DIRAC 0.1.1.post1) with a BallTree radius graph and GCN backbone.
RNA: HVGs (Seurat v3), PCA(30); ADT: standardize.
Train 500 epochs; then Leiden clustering on the learned embedding.
Environment & Version Pinning
Python ≥ 3.9
Packages:
scanpy,anndata,numpy,pandas,matplotlib,torch,sodirac_test==0.1.1.post1(older DIRAC API)
Recommended install (example): pip install “sodirac_test==0.1.1.post1” scanpy anndata numpy pandas matplotlib torch
If you already have 0.1.8 installed, consider a fresh environment to avoid API drift.
Data & Layout
Expected input files under
data_path(example below uses/home/project/11003054/changxu/Data/DBit_seq):{data_name}_RNA.h5ad{data_name}_Protein.h5ad
This demo uses
data_name = "0725".
Step-by-Step Pipeline
1) Imports, seed, palette
[1]:
import os
import pandas as pd
import numpy as np
import torch
import scanpy as sc
import anndata
import matplotlib.pyplot as plt

######## load dirac
import sodirac as sd
sd.utils.seed_torch(seed=0)

colormaps= ["#E41A1C", "#377EB8", "#4DAF4A", "#984EA3", "#FF7F00", "#A65628", "#FFFF33", "#F781BF", "#999999",
            "#E5D8BD", "#B3CDE3", "#CCEBC5", "#FED9A6", "#FBB4AE", "#8DD3C7", "#BEBADA", "#80B1D3", "#B3DE69", "#FCCDE5",
            "#BC80BD", "#FFED6F", "#8DA0CB", "#E78AC3", "#E5C494", "#CCCCCC", "#FB9A99", "#E31A1C", "#CAB2D6","#6A3D9A", "#B15928"]

data_path = "/home/project/11003054/changxu/Data/DBit_seq"
data_name = "0725"
methods = "DIRAC"
[easydl] tensorflow not available!
2) Load data & basic metadata
[2]:
adata_RNA = sc.read(os.path.join(data_path, f"{data_name}_RNA.h5ad"))
adata_Protein = sc.read(os.path.join(data_path, f"{data_name}_Protein.h5ad"))
adata_RNA.raw = adata_RNA
adata_Protein.raw = adata_Protein

# number of clusters guided by ground truth (if available)
n_clusters = len(adata_RNA.obs["ground_truth"].unique())

# tag modality for diagnostics (optional)
adata_RNA.obs["Omics"] = data_name + "_mRNA"
adata_RNA.obs["Omics"] = adata_RNA.obs["Omics"].astype("category")
adata_Protein.obs["Omics"] = data_name + "_Protein"
adata_Protein.obs["Omics"] = adata_Protein.obs["Omics"].astype("category")
3) Preprocess (RNA & Protein)
[3]:
# RNA: filter → normalize → log1p → HVGs (Seurat v3) → scale → PCA(30)
sc.pp.filter_genes(adata_RNA, min_cells=3)
sc.pp.normalize_total(adata_RNA)
sc.pp.log1p(adata_RNA)
sc.pp.highly_variable_genes(adata_RNA, n_top_genes=3000, subset=True, flavor="seurat_v3")
sc.pp.scale(adata_RNA)
sc.tl.pca(adata_RNA, n_comps=30)  # -> adata_RNA.obsm['X_pca']

# ADT/Protein: standardization
sc.pp.normalize_total(adata_Protein)
sc.pp.log1p(adata_Protein)
sc.pp.scale(adata_Protein)
4) Spatial graph (BallTree, radius + k)
[4]:
# Build adjacency with BallTree + radius, plus kNN fallback inside the graph builder
# rad_cutoff is in "spatial coordinate units" (DBiT-seq pixel units). Tune if neighborhoods are too sparse/dense.
adj = sd.adj.graph(
        data=adata_RNA.obsm["spatial"],
        rad_cutoff=1.5,
        k=8,
        distType="BallTree"
    ).main()["adj_norm"]

# Convert normalized adjacency to COO and then to edge_index (PyTorch geometric style)
row, col, edge_attr = adj.t().coo()
edge_index = torch.stack([row, col], dim=0)

# prepare batch/domain labels (required by old API)
# Here we treat each modality as a separate domain; batches align with 'Omics' categories
y = pd.Categorical(
        np.array(adata_RNA.obs["Omics"]),
        categories=np.unique(adata_RNA.obs["Omics"])
    ).codes
5) Pack data & train DIRAC
[5]:
save_path = os.path.join("./Results", f"{data_name}_{methods}")
os.makedirs(save_path, exist_ok=True)

# Initialize old integrate_app
unsuper = sd.main.integrate_app(save_path=save_path, use_gpu=True, subgraph=False)

# Package datasets; note batch_list/domain_list usage in 0.1.1.post1
samples = unsuper._get_data(
        dataset_list=[adata_RNA.obsm["X_pca"].copy(), adata_Protein.X.copy()],
        batch_list=[y, y],
        domain_list=[np.zeros(adata_RNA.shape[0]), np.ones(adata_Protein.shape[0])],
        edge_index=edge_index
    )

# Model: GCN, smaller dims per the original reproduction
models = unsuper._get_model(samples, n_hiddens=64, n_outputs=16, opt_GNN="GCN")

# Train; note the older API returns (data_z, combine_recon, now_timestamp)
data_z, combine_recon, now = unsuper._train_dirac_integrate(
        samples=samples,
        models=models,
        epochs=500,
        lamb=5e-3,
        scale_loss=0.05,
        lr = 1e-3,
        wd = 5e-2,
    )

# Attach the learned joint embedding
adata_RNA.obsm["combine_recon"] = combine_recon
adata_Protein.obsm["combine_recon"] = combine_recon
Found 2 unique domains.
Project..: 100%|█| 500/500 [00:09<00:00, 54.21it/s, Loss=149
6) Neighbors, clustering, spatial plot, save
[6]:
# Neighborhood graph on the joint embedding, then Leiden with automatic resolution
sc.pp.neighbors(adata_RNA, use_rep="combine_recon")
res = sd.utils._priori_cluster(adata_RNA, eval_cluster_n=n_clusters)
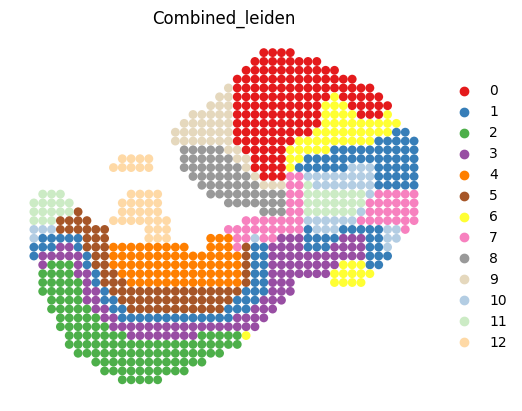
sc.tl.leiden(adata_RNA, resolution=res, key_added="Combined_leiden")
# Spatial plot
sc.pl.spatial(
adata_RNA,
color=["Combined_leiden"],
palette=colormaps,
frameon=False,
spot_size=1,
show=False
)
plt.savefig(
os.path.join(save_path, f"{data_name}_{methods}_Combined_spatial_{now}.pdf"),
bbox_inches="tight", dpi=300
)
Best resolution: 0.6400000000000001
Version Compatibility (0.1.1.post1 ↔ 0.1.8)
Package name: Your code imports
sodirac_test. If you use ≥0.1.8 and the package name issodirac, update imports accordingly.Graph utilities: Newer DIRAC often exposes simpler helpers (e.g.,
sd.utils.get_single_edge_index). Ifsd.adj.graph(...).main()is unavailable, switch to the newer API with a comparable k/radius setting.Training return values: In 0.1.1.post1,
_train_dirac_integrate(...)returns three values(data_z, combine_recon, now). Recent versions may return two; adjust unpacking accordingly.Sampler arguments:
batch_list/domain_listhandling may differ. If you move to 0.1.8, check the signature of_get_data(...)and remove/rename arguments as needed.Defaults: Learning-rate/weight-decay defaults may have changed. If results look different, set them explicitly to match the old behavior.
If your goal is strict reproduction, pin
sodirac_test==0.1.1.post1and run this tutorial as-is. For new projects on 0.1.8, keep the overall logic but update the graph builder and training calls per the latest docs.